This is the second article in the series FIVE different reporting technologies included in Sage Financials. Following on from the first article on Key Financial Reports, this article is a primer for Salesforce Reports.
- FIVE different reporting technologies included in Sage Financials
- Key Financial Reports
- Salesforce Reports
- Sage Intelligence
- Einstein Analytics
- Financials Reporter
Getting to grips with Salesforce Reports
Sage Financials extensively uses Salesforce Reports – for example Aged Debtors & Creditors reports, and the Balance Sheet and PnL drill down displays the detailed data in a Salesforce Report.
The easiest way to get to grips with Salesforce Reports is to modify existing Sage Financials report. But first look through the details below to get an understanding of how the Salesforce Reporting model works and refer back to this article as you explore the different features.
*** WARNING *** always click ‘Save As’ to make a copy of a Sage Financials report BEFORE editing it!
Salesforce Reporting model
Salesforce provides a powerful reporting engine which is used extensively in Sage Financials and provides an excellent tool for presentation of data. This diagram summarises the Reporting Model.
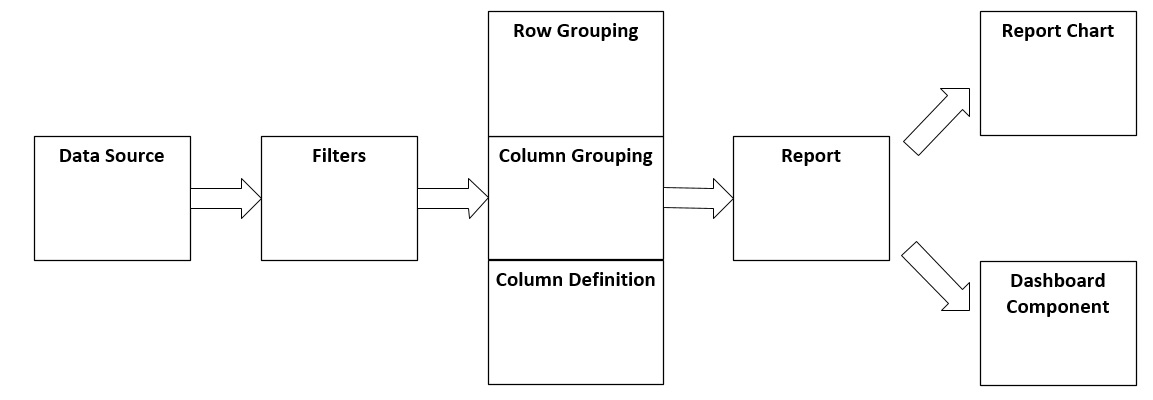
To create a report in Salesforce, first you define the data source (Report Type), then in the Report editor you can define Filters, along with Row & Column Groupings and Column Definitions to setup how the Report is displayed. You can add Charts to the Report and use the Report as the source for a Dashboard Component.
Data Source (Report Type)
When you create a [New] report, the first thing you need to choose is the ‘Report Type’ which is the data source for Salesforce reports:
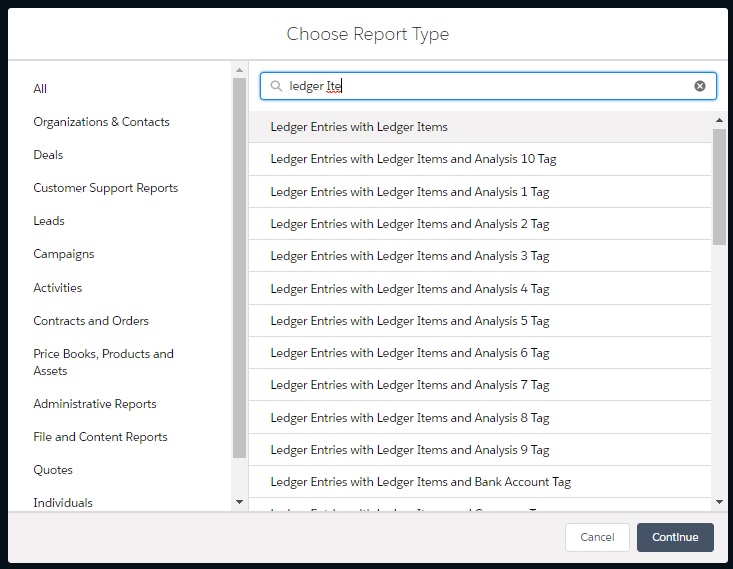
The data source is where the data comes from – from the Dimension Tag, or the Ledger Item for example.
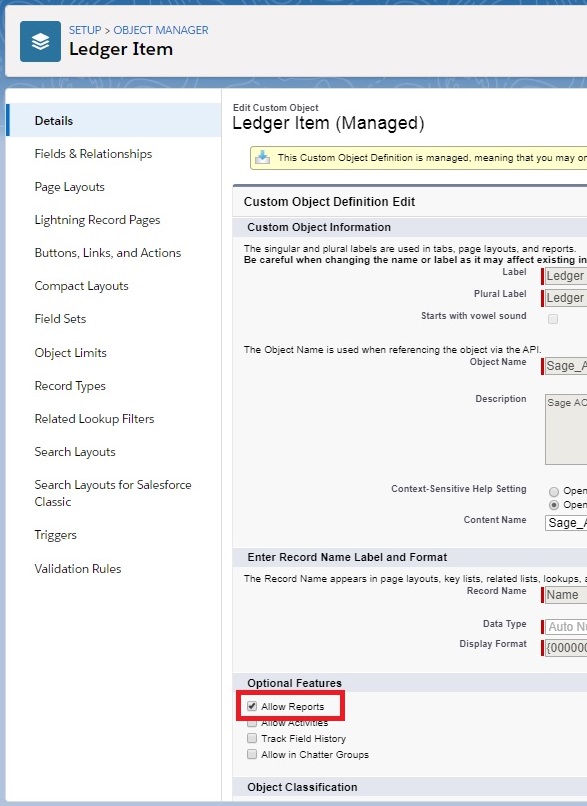
You can create your own ‘Custom Report Type’ where you can define parent-child objects and the fields to be available and Sage Financials makes use of several Custom Report Types. However, all Salesforce Objects & related Objects can be used as ‘Report Types’, providing the object is setup to ‘Allow Reports’:
From the Object Details click [Edit]:
Typical Report Types are:
- Ledger Entries with Ledger Items†
- Dimension† with Dimension Tag
- Journals and Journal Items†
- Transactions and Transaction Items†
- Ledger Balances
† You may need to turn on ‘Allow Reports’ for this object
The Report Type is displayed in the top left when editing reports:
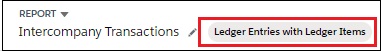
NB: Report Types only let you walk DOWN the hierarchy tree, so you can select ‘Journal Items with Journal Item Tags’, but you CANNOT select ‘Journal Items with Journal Item Tags and Tags’. But what you CAN do is add required Tag information as formula fields to the ‘Journal Item Tags’ object.
Filters
Once you have chosen the ‘Report Type’ you enter the Report Editor and can edit the Filters:
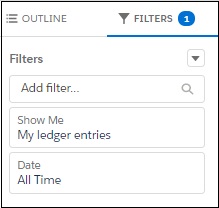
There are some key filters you need to edit:
- By default, Salesforce always chooses ‘Show Me: My ledger entries’ and you need to change this to ‘Show Me: All ledger entries’
- You can use the Date filter, but generally set this to ‘All Time’
- For Ledger Entries and Ledger Items include the ‘Layer’ field.
Set a filter of ‘Actual’ for this field otherwise you will also get ‘Actual Deleted’ - For Ledger Entries and Ledger Items include the ‘Draft’ field.
Set a filter of ‘False’ for this field to exclude draft Ledger Entries. - In a multi-company environment you can filter by a particular Company name, or you can use ‘Is Current Company’ to filter by whatever company you are currently in.
- ‘Is Reporting FY’ and ‘Is Reporting Period’ are setup in ‘Financial Reports’:

and can then be used as filters in the reports - With Journals & Transactions, you might want to set a filter of ‘Posted’ for the ‘Status’ field to avoid unposted transactions.
NB: In Edit mode you only see a sample of the data previewed, you need to click on [Run] report to see the full data set.
Column Definitions
You can use the ‘Outline’ tab to choose which fields to display:
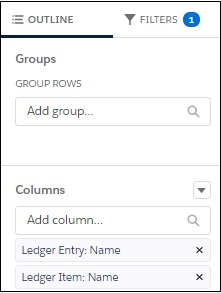
With a Report Type of ‘Ledger Entry with Ledger Items’ you can choose fields from either the Ledger Entry object or the Ledger Item object. But some of the fields appear in BOTH objects, so make sure you choose the field from the right Object!:
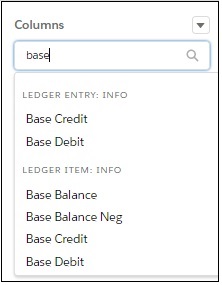
You will want the Base Cred and Base Debit from the Ledger Item, not the Ledger Entry!
Row and Column Grouping
You can Group Rows by many different fields, for example by Ledger Account which summarises by Ledger Account and then displays a Subtotal for Cr & Db:
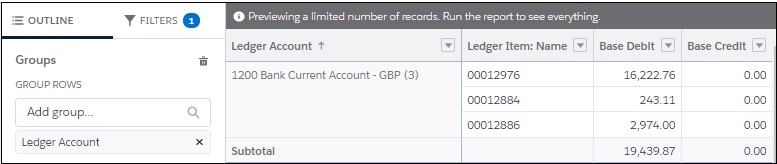
Typical fields you might group by include:
- Customer Tag
- Supplier Tag
- Analysis Tag (picking up Dimension Tags linked to Ledger Items for Departmental Analysis)
- Product Tag
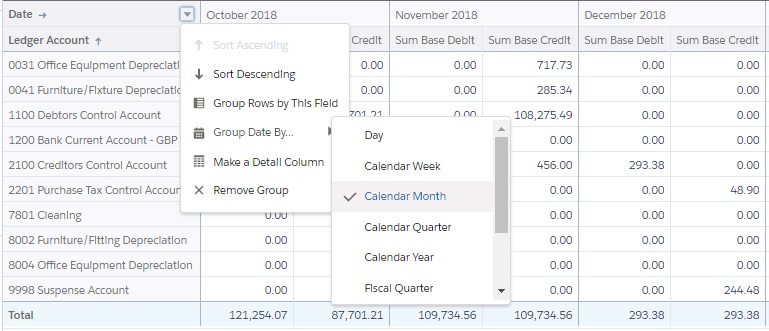
The Date field is often used for Column Grouping, but usually you want to set the ‘Group Date By…’ to ‘Calendar Month’ or similar to get a matrix style report:
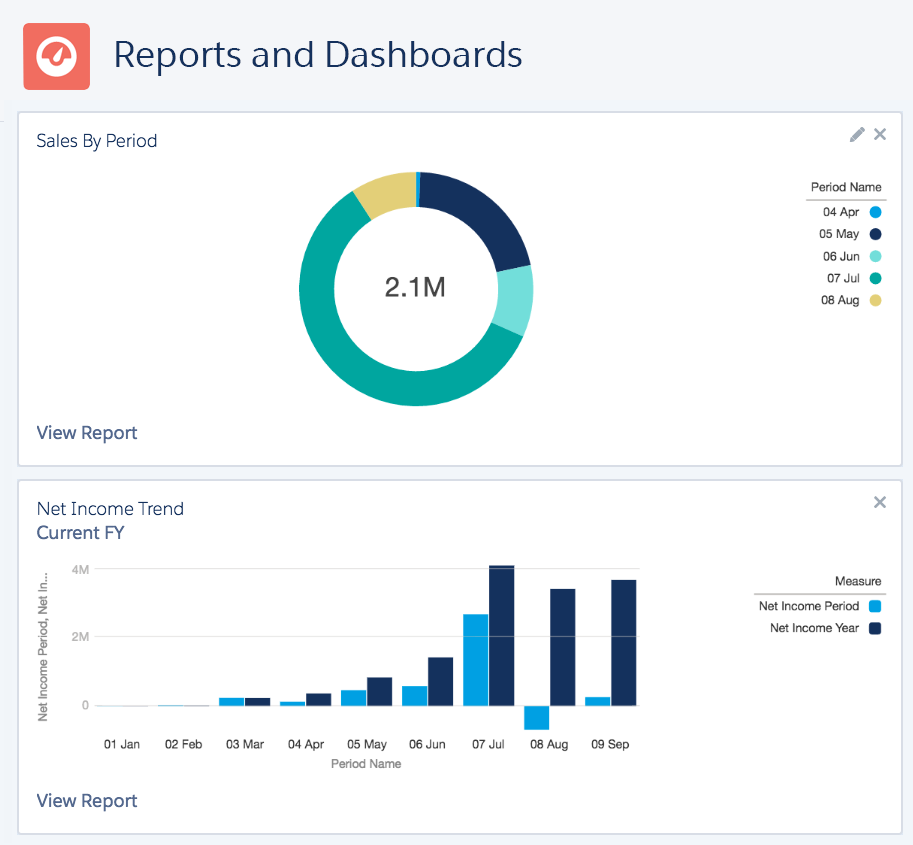
Charts & Dashboards
Once you have created your report you can add a chart for clarity. In both Report Charts and Dashboard Components you can choose from a variety of chart types, but they all work in a similar way. You must have a Row or Column Group, and these are the basis for grouping in the charts as well.
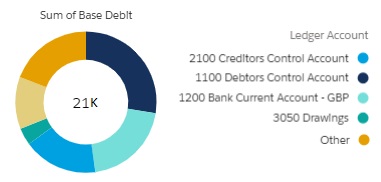
The chart is displayed when you view the report, and one of the nice features is you can click on a sector of this doughnut, and the report drills down to show just those value.
Or you can add the report as a component to a Dashboard. This enables you to collect several key metrics into a single place for easier analysis:
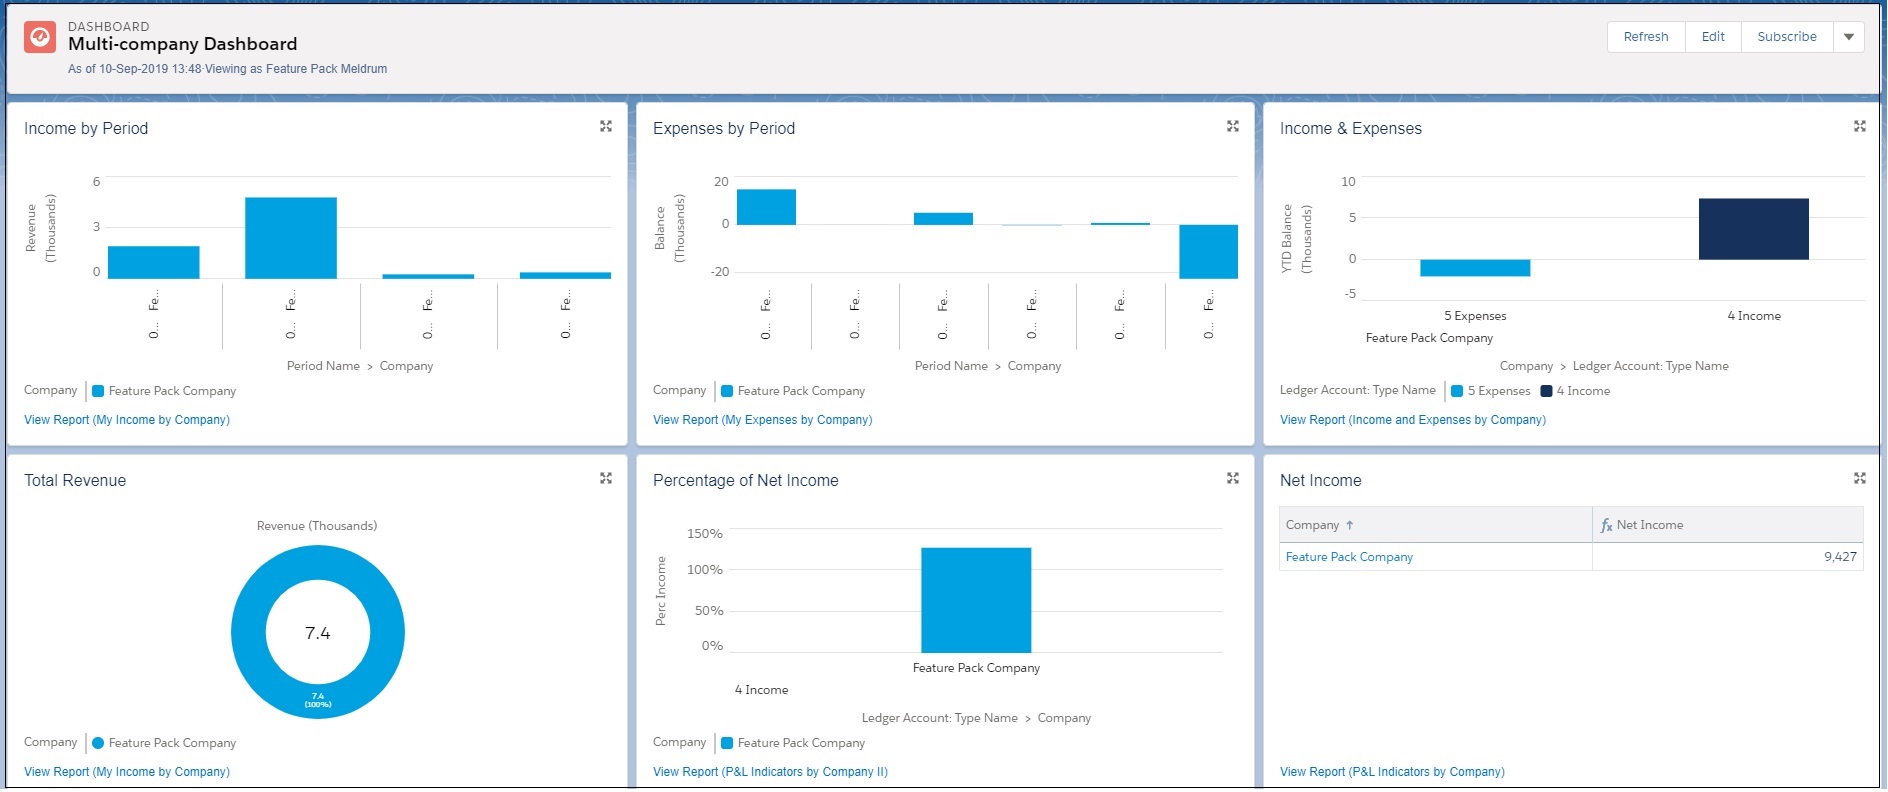
Dashboards can be used for many purposes:
- Analysis of your financial position
- Displaying key metrics in real time – sales/expenses by Project or Department, profit margin by Product Type and many others.
The key is to identify THE metric that best measures the success of you company. - Creditor & Debtor analysis
- Error detection – display balances of Ledger Accounts you would expect to be zero – eg ‘Suspense Account’ or ‘Payroll Liability’
With all dashboard components you can drill down to display the actual report the component is bases on
Further Reading
Salesforce Reports have a host of powerful features, and some other features you might want to look into are:
- Using Fields View instead of Outline
- Filter Logic
- Joined Reports
- Cross-filters
- Bucket Fields
- Formula Summaries
- Home page dashboards
- Showing or hiding: Row Count; Details Rows; Stacked Summaries
- Here is a great blog covering Report Types:
Did you find this useful? Please register to receive regular updates from Sage Financials knowhow.
If YOU are looking for training on reports, please fill in the Alpha Index enquiry form