Sage Financials gives you no less than FIVE different reporting technologies:
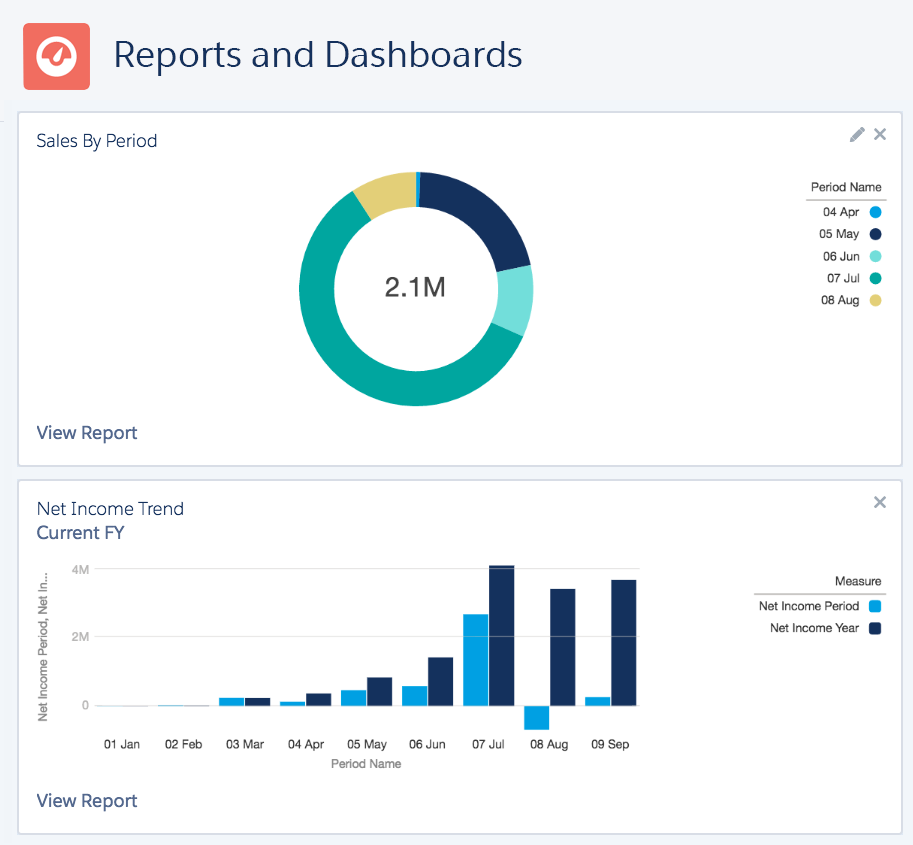
- Key Financial Reports
- Salesforce Reports
- Sage Intelligence
- Einstein Analytics
- Financials Reporter
Each one has its own unique benefits and this is the first of a series of articles to explain how they work and what you can do with them. This is the first article covering ‘Key Financials Reports’.
Key Financial Reports
The ‘Key Financial Reports’: Balance Sheet; Profit & Loss; Trial Balance can be accessed from ‘Reports – KEY FINANCIAL REPORTS’ subtab and all work using the same technique:
- You click on the report and then ‘Create New’ or ‘Refresh’ the reports to create a dataset for the chosen Company, Financial Year and Period.
- This dataset is then used by a Visualforce Page to display the report.
- The Visualforce Page provides drill down on each figure, opening up a Salesforce Report to display the detail.
KEY POINT: If you change the data by posting new transactions, or unposting old transactions, the dataset will be updated, but if you make changes to the Chart of Accounts, or the report configuration, you have to ‘Refresh’ the report to see the current data.
Configuring ‘Key Financial Reports’
You can change the way these reports work through ‘Configuration – LEDGER ANALYSIS’ subtab. Here you will see one ‘Ledger Analysis’ for each ‘Key Financial Report’.
WARNING – Always create a Clone of the Ledger Analysis before making any changes. Correctly setting the Ledger Analysis is not straight forward and getting it wrong can completely break your reports.
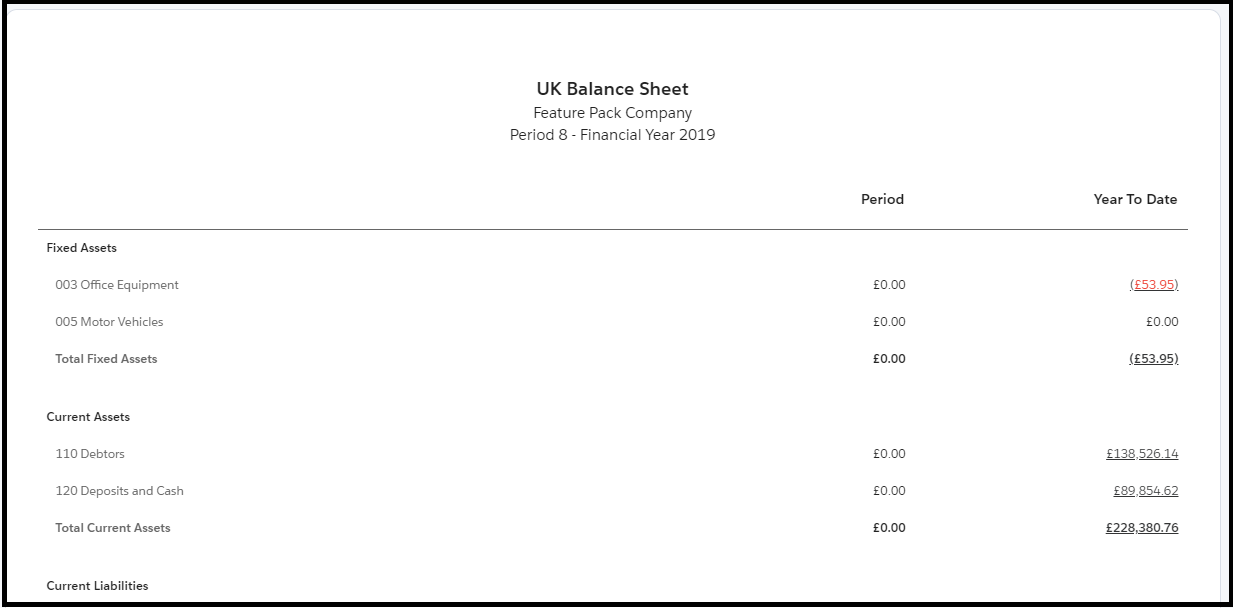
The Balance Sheet un-packed
Here is a standard Balance sheet with Period and YTD columns. Let’s see how its setup:
From the ‘Configuration – LEDGER ANALYSIS’ subtab you can open the Ledger Analysis for ‘Balance Sheet’ which consists of Column definitions and Row definitions:
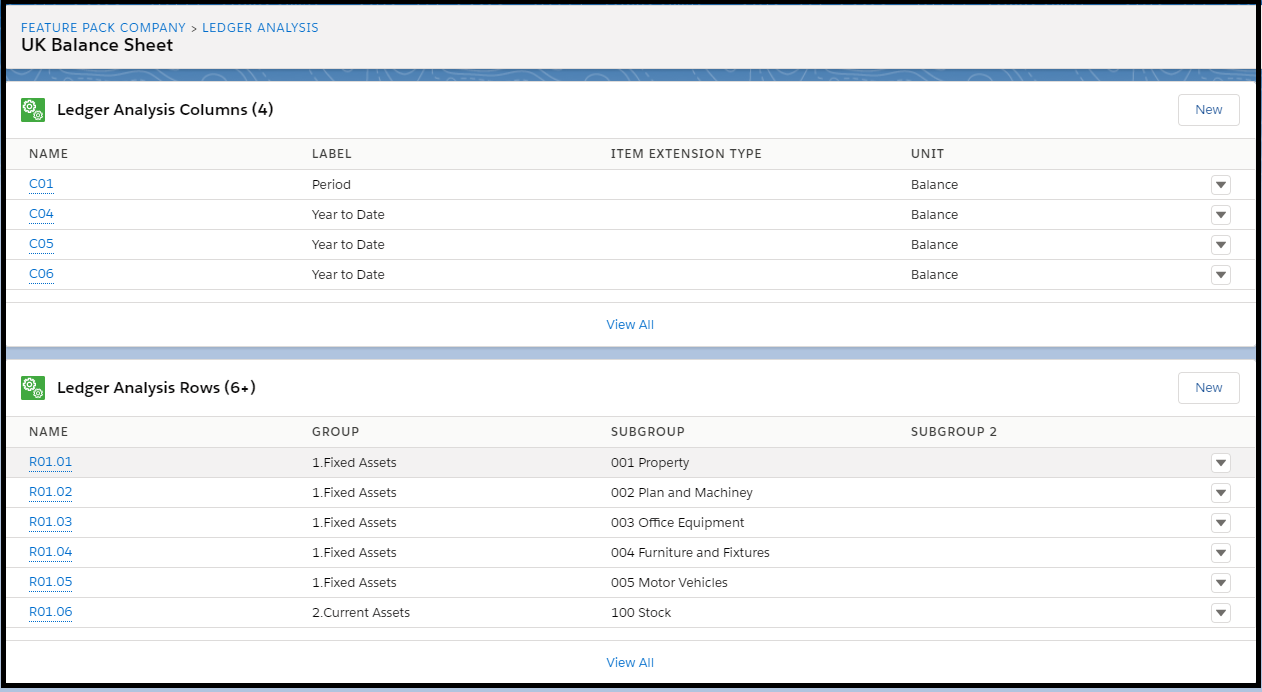
The first thing to notice is there are four columns definitions, but only two columns in the Balance Sheet report.
Drilling into a column definition, the ‘Period’ column definition is reasonably easy to understand:
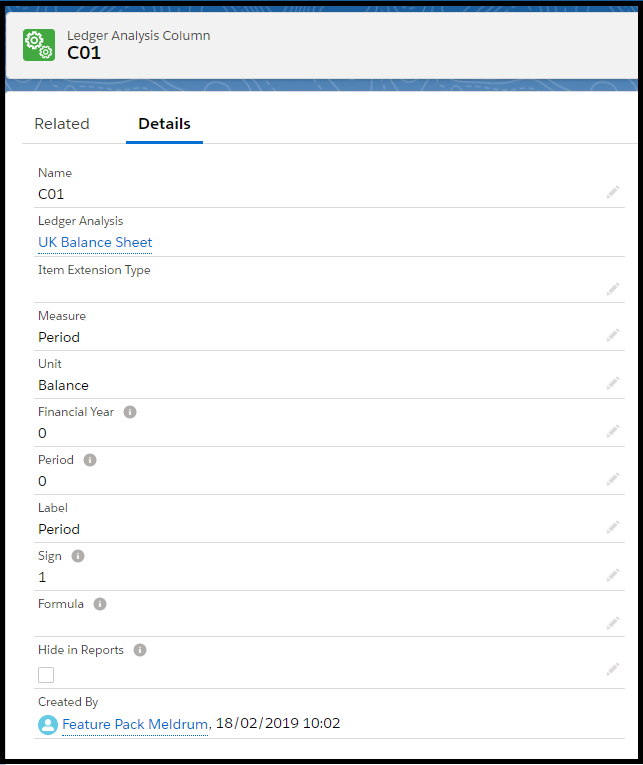
Financial Year of zero and Period of zero simply means it uses the FY and Period you selected. The other fields should make sense.
Columns C04 and C06 are identical so far as I can see, using a measure of ‘TTD’ which I believe means YTD plus opening balances.
C05 is different, with Financial Year -1 indicating the previous FY and Period 98 indicating the Year Closing value. It also uses a measure of ‘YTD’ excluding the opening balances(?) (see https://help-financials.sage.com/en-gb/Configuration/Define%20fiscal%20periods%20for%20companies.htm?Highlight=period%2098)
Its only when you look at the Row definitions that this all makes sense.
Row Definitions
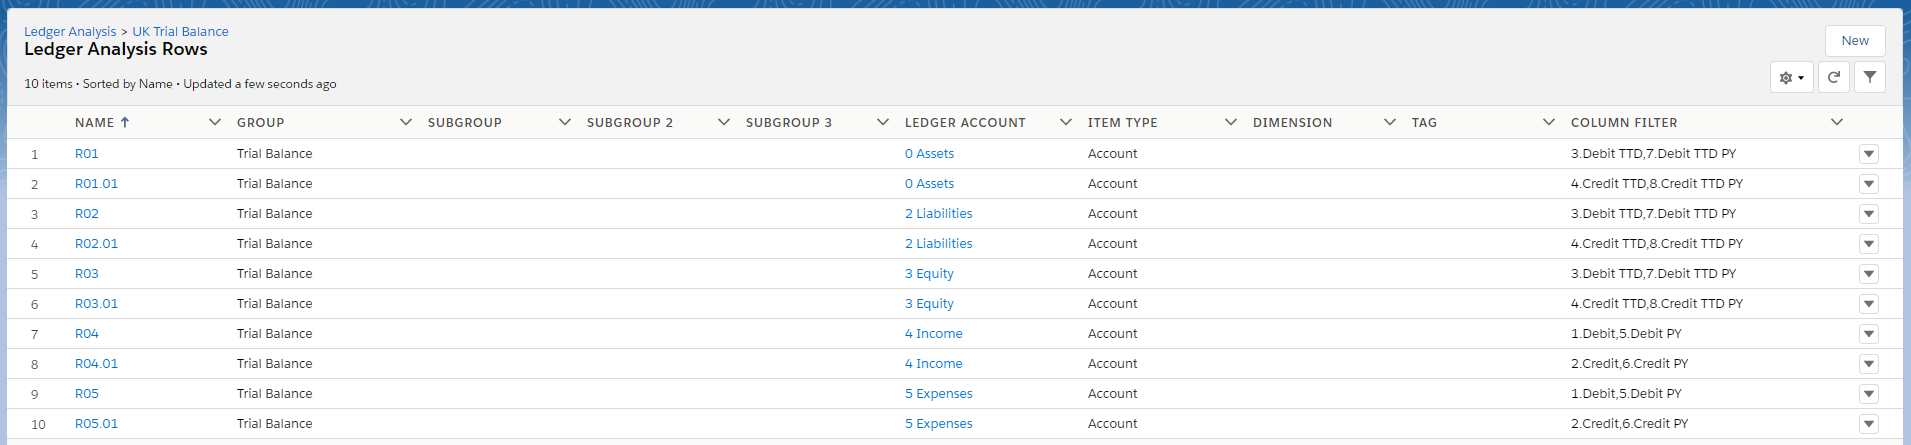
From the Ledger Analysis click on ‘View All’ to display the Ledger Analysis Rows and check out the field ‘Column Filter’:
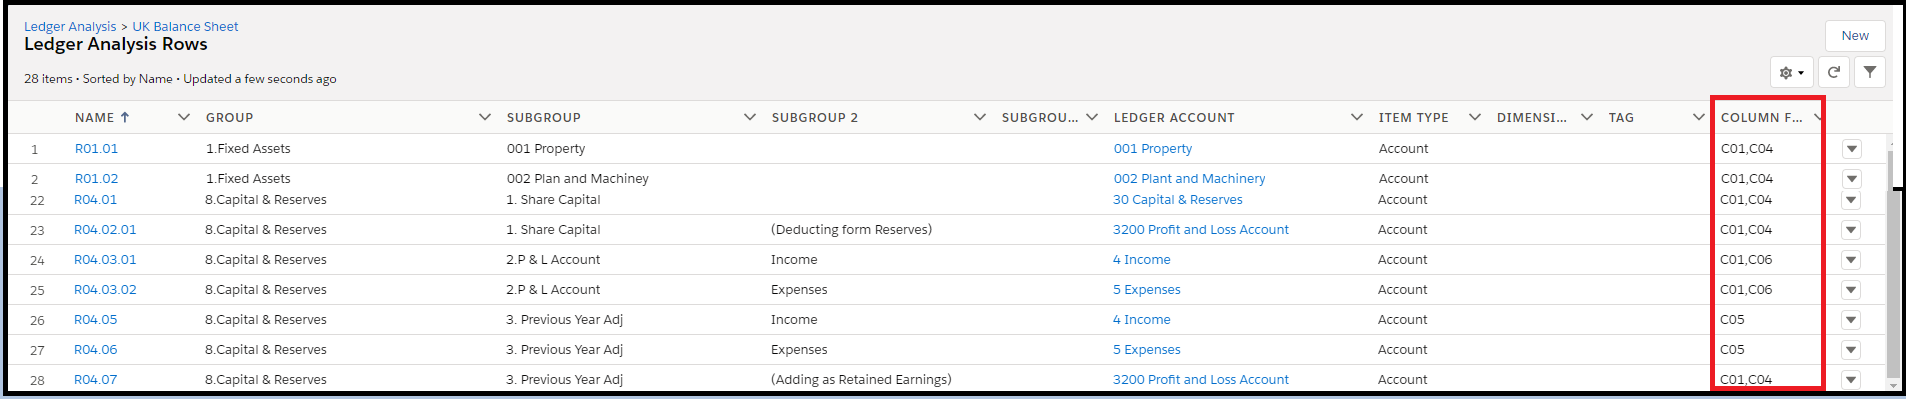
Most rows display column C01 and C04, but some display C01 and C06 (a bit odd as C06 is identical to C04…) and some display C01 and C05 to display the ‘previous year’ figure.
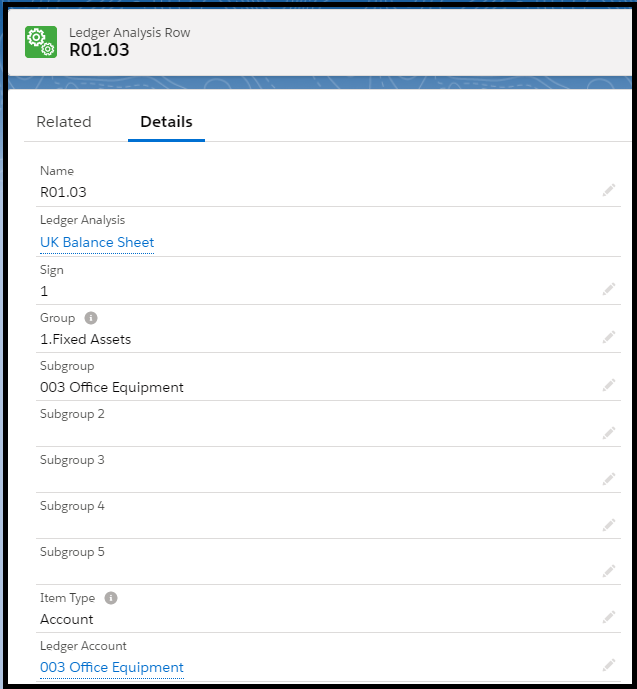
Looking at one Row the ‘Group’ defines to top level header the data appears under, and the Subgroup the subhead. The Item Type of ‘Account’ and the Ledger Account of ‘003 Office Equipment’ results in a summing up of the balances for all the Subaccounts of ‘003 Office Equipment’.
TIP: The commonest error with this report is when one of the Accounts is missed out. If you modify the CoA you may also need to modify the Ledger Analysis.
PnL un-packed
The PnL works in a simpler way with the 3 columns visible on the report controlled by 3 columns definitions in the Ledger Analysis:
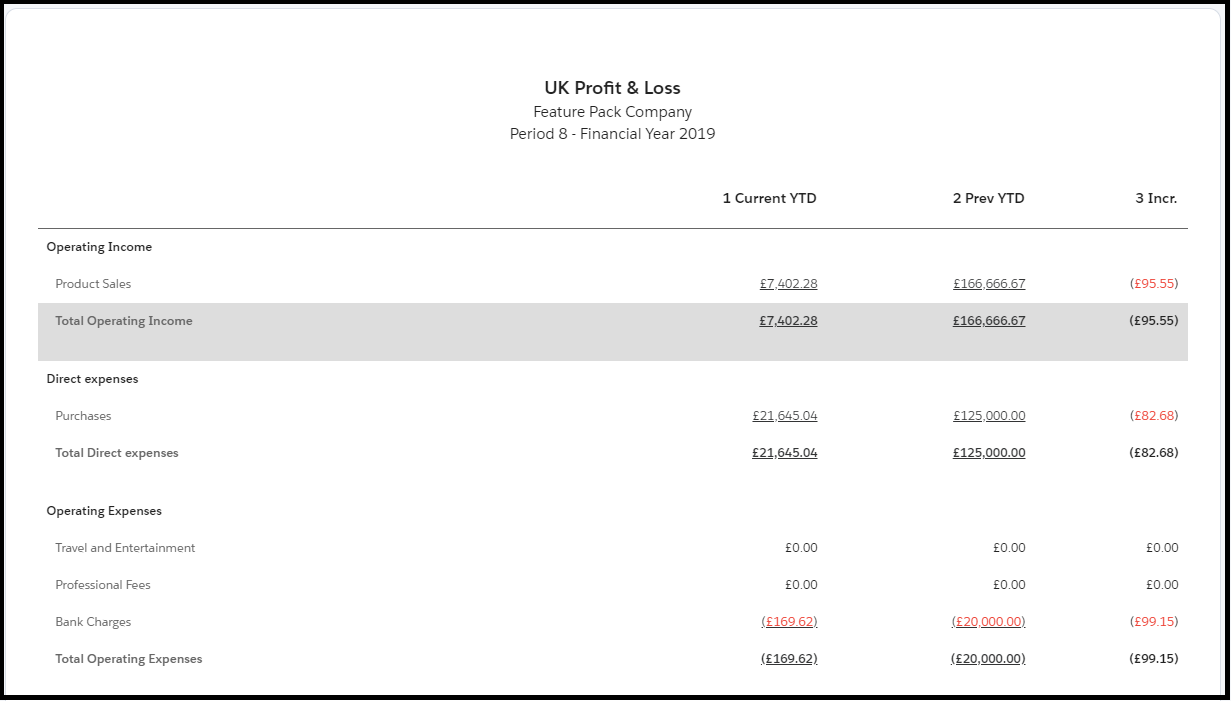
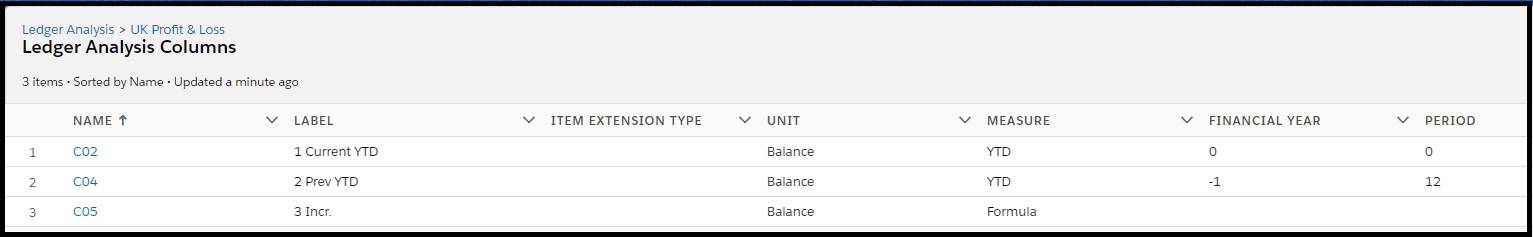
C02 is YTD (note excluding the opening balances as they are not used in PnL) C03 is previous and C04 the increase/decrease using the formula:
((VAR(“1 Current YTD”) – VAR(“2 Prev YTD”))/ VAR(“2 Prev YTD”) * 100)
However, as pointed out by Stephen Waller, this formula gives you a percentage, but is displayed as currency (£95 instead of 95%). A better option is to edit this to:
VAR(“1 Current YTD”) – VAR(“2 Prev YTD”)
Which will give you the difference. But note this is the difference between the total for the previous financial year against the YTD for the current financial year.
The Row definitions do not use ‘Column Filter’ so just display all three columns.
Trial Balance
The Trial Balance makes substantial use of the Column Filter in the Row Definitions:
Income and Expenses use the ‘YTD’ value (ie excluding opening balances) whereas Assets & Liabilities use ‘TTD’ to include the opening balances.
The Report Dataset
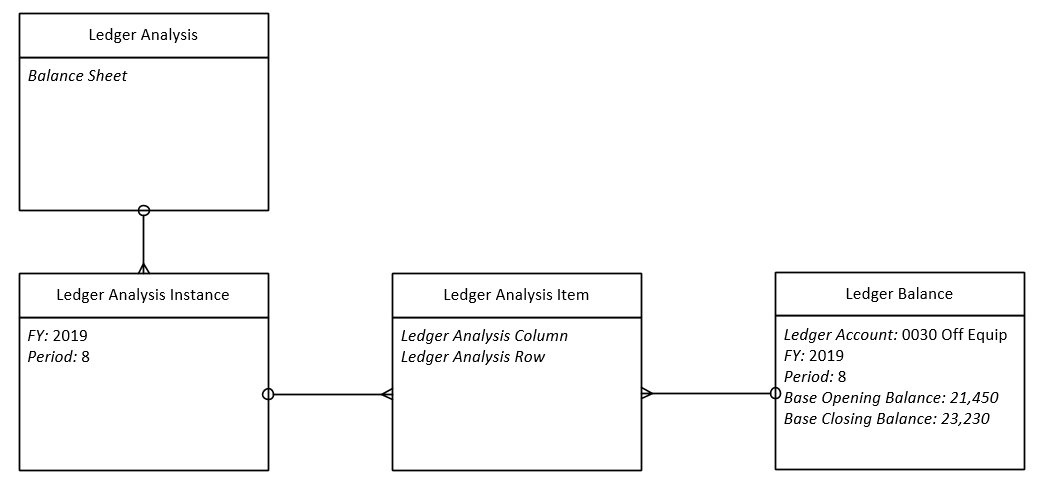
As well as Columns & Rows, the Ledger Analysis record for each report type has ‘Ledger Analysis Instances’ which are created when you click ‘Create New’ or ‘Refresh’ the report. You have one ‘Ledger Analysis Instance’ for each FY & Period you report on.
The ‘Ledger Analysis Instance’ then has one ‘Ledger Analysis Item’ for each data point in the report. The actual VALUE displayed in the report comes from the ‘Ledger Balance’ object. The Ledger Balance records are kept in sync with the Ledger Items postings so the reports should always display the correct figures. It is possible for the Ledger Balances to become out-of-sync with the Ledger Items and this can be very confusing as the figures in the Balance Sheet or PnL do not agree with those in your Nominal Ledger. If you have unexpected figures, always start by ‘Rebuilding Balances’ (see Sage Help: https://help-financials.sage.com/en-gb/General%20Ledger/Rebuild%20ledger%20balances.htm?Highlight=Rebuild%20Balances)
Did you find this useful? Please register to receive regular updates from Sage Financials knowhow.
If YOU are looking for training on reports, please fill in the Alpha Index enquiry form